This blog post represents a continuation of the manuals regarding VASO acquisition and VASO signal analysis. It deals with the question of quantifying the VASO signal change with respect to the baseline blood volume at rest. In this post, I try to provide an overview of the values of baseline blood volume in the literature, I hypothesise reasons for their discrepancy and conclude by arguing that one should refrain from analyzing VASO in relative units after all.
The VASO-fMRI method uses an inversion-recovery T1-weighting sequence to selectively null the magnetization of blood water. This means that in a VASO experiment, the MRI signal comes from anything else, but the blood. And during enhanced neural activity, the blood volume increase results in a net signal decrease of the voxel.
VASO measures CBV change in absolute units of voxel volume.
This indirect way of measuring cerebral blood volume (CBV) changes is qualitatively different to comparable sequences of ASL or comparable CBV modalities of contrast agent-based blood volume mapping. Namely, the VASO contrast is solely designed to measure changes in blood volume relative to the overall signal in the voxel, in units of ml blood volume change per 100 ml of the tissue. And VASO does not allow a straightforward extraction of baseline blood volume.
This means that the raw VASO signal is acquired in arbitrary MR units. For example, in my own VASO experiments on a SIEMENS system, I am used to VASO signal values in the conventional SIEMENS value-range, say 1822, and during activity, the signal drops by 2% to 1800. Such values would suggest that 2% of the voxel volume are now additionally filled with black blood and the absolute blood volume raised by 2 ml per 100 ml of tissue. With VASO alone it is not given how much those 2 ml per 100 ml of tissue represent compared to the baseline blood volume.
Historical inheritance to estimate CBV changes in units of the baseline CBV.
In previous functional blood volume mapping techniques of positron-emission tomography, optical imaging spectroscopy, and contrast agent based MRI, however, the functional blood volume change was usually provided in relative units of the baseline blood volume. With those modalities, an activated voxel with -say- 5% baseline blood volume that would have a blood volume increase to 7%, would be reported as a relative blood volume of 40% (from 5% to 7%).
The main reason for this historical convention is that all of these methods (i.e. MION, OIS, PET), provide the raw CBV signal in inherently normalized units of the baseline CBV. Only with additional calibration experiments, the absolute CBV change in units of ml per 100ml of tissue can be estimated.
Due to this historical inheritance of reporting CBV changes in relative units, the first decade of VASO researchers were pressured to also report their blood volume increase in the relative units of CBV increase normalized to the baseline blood volume. However, since VASO did not provide a number of baseline blood volume, they were forced to rely on more-or-less appropriate literature values of assumed baseline blood volume to normalize their absolute VASO values. Of course, the ultimately reported relative CBV changes measured with VASO were directly scaled by the specific value that was assumed.
There are about 70 original VASO fMRI papers, and approximately 50 of which assumed a baseline blood volume value. In all of those papers that normalized the VASO signal change to assumed baseline CBV values, the value was either 5.0% or 5.5%. However, until today, this number is continuously challenged by experts in the field and there is no generally accepted consensus, yet.
Below, I would like to give an overview of the most often reported values of baseline blood volume in cortical gray matter across a wide spectrum of modalities.
Literature values of baseline CBV: summary of PET, MRI and optical review papers
Due to its importance for early VASO studies and the understanding of the signal origin in BOLD fMRI, values of baseline blood volume have been investigated with a number of methods over many decades. Some of the most cited review articles are listed below:
- Hanzhang Lu, the inventor of VASO discussed the issue of baseline blood volume assumption in a highly respected review article in 2013. He and his colleagues find the most plausible value to be in the order of 5.5 ml per 100 ml of tissue within cortical gray matter: Lu H, Hua J, van Zijl PCM. Noninvasive functional imaging of cerebral blood volume with vascular-space-occupancy (VASO) MRI. NMR Biomed. 2013;26(8):932-948. doi:10.1002/nbm.2905
- One of the most comprehensive overviews of baseline blood volume was compiled as part of establishing a new gadolinium based VASO version. The review revealed that within cortical gray matter the baseline blood volume would be in the order of 4.8 to 5.5 ml / 100 ml of tissue.
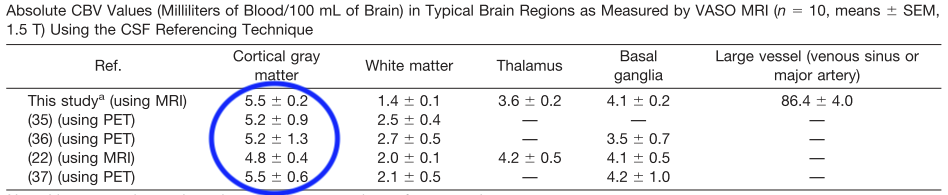
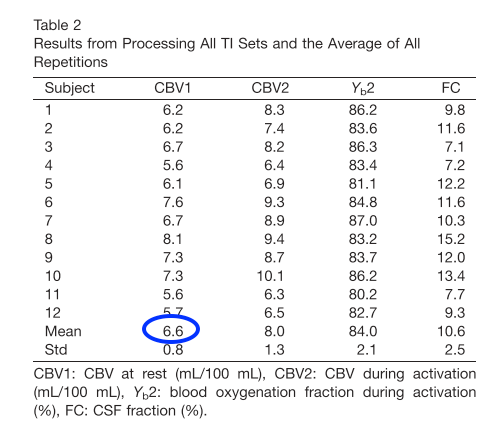
- Yet another CBV mapping study from Yale University that also accounts for partial volume effects found values to be in the order of 6.6 ml per 100 ml of tissue.
- The single most cited study of baseline CBV values is the PET study from Leenders et al. in 1990. This study finds values of 4.3 – 8.6 ml per 100 ml of cortical gray matter tissue.

The values of this article are also used in depth-dependent vascular deconvolution models from Havlicek and Uludag (2019).
- A recent review article by Schmid et al. summarized the vascular density values in cortical gray matter that have previously been recorded in ex-vivo samples by means of immunohistochemistry. These values are much lower that the ones reported in the studies above and in the range of 1% to 3%.
The discrepancy of baseline CBV values obtained in-vivo from positron-emission tomography, optical imaging spectroscopy, and contrast agent based MRI to values from ex-vivo histology has led to numerous debates at conferences, manuscript reviews and even social media. Below I try to hypothesize, where this discrepancy might come from.
Why are CBV rest values from histological techniques a factor of 2-3 smaller than MRI- and PET-based results?
Classical Indian ink fillings and electron microscopy of corrosion casts provided stunning images that deeply influenced the intuitive understanding of the origin of the laminar fMRI signal. However, when it comes to three-dimensional quantitative characterization of the vascular topography at a spatial resolutions that allow estimations of the diameters of capillaries, other histological methods are used. I.e. a combination of immunohistochemistry and stereology with fluorescently labeled vasculature and laser ablation is becoming popular.
While these techniques are extremely helpful to characterize relative variations of vessel diameters and vascular density across layers and brain areas, they might be less appropriate to measure the overall baseline blood volume that is relevant for the laminar fMRI voxels in the range of 0.8 mm voxels sizes. Below I list three possible reasons why I think so:
- The preparation of cadaver brain samples results in tissue shrinkage.
One potential source of confounds of histological techniques that requires further studies is the problem that cadaver brain samples considerably shrink during the fixation process. The shrinkage factor are up to 25%. This might affect the estimation of volume contributions between vessels and parenchyma respectively.
- Large vessels that are often missed.
Another potential reason for the mismatch between PET-values and histology values comes from the problem that larger vessels are sometimes lost during the sectioning of the tissue.
- Death has an effect on the blood volume.
Usually, when researchers refer to baseline blood volume in VASO experiments, they would like to refer to the blood volume without a functional task, but with an otherwise unaltered physiological state. However, there are a number of important vascular modulatory factors that can affect the vascular volume aside from the task. E.g., the baseline CBV without a functional activation is expected to be significantly altered in experimental settings that affect the arterial blood pressure, which is particularly important when taking reference values that were derived from animals during anesthesia.
The most extreme physiological state that affects the arterial blood pressure is death. Personally, I wouldn’t be surprised if most of the blood vessels are almost fully drained after death. After all, dead people look very pale, which is usually a sign of constricted blood vessels. Thus, it would make sense to me that the baseline blood volume is less for ex-vivo samples compared to in-vivo measurement.
I had a hard time finding good references that investigate how much the blood volume shrinks when an animal or a human dies. The only bit of reliable information that I found about this was in textbooks for medical students regarding autopsy of human cadavers. Namely, after the death of a human, the arterial and arteriolar vessels are almost completely emptied. The blood, instead, is collected in dilated large veins. I would expect that this would affect the baseline CBV values in ex-vivo data too.
Together with Aneurin Kennerley at the University of Sheffield, we were in the lucky/unlucky situation that a rat died right during a VASO experiment. The data that we got in this ‘single case study’ suggested a vasoconstriction in the order of 30%-50%.
Another indication of reduced baseline CBV after death might come from the fact that almost all T2*-weighted ex-vivo MRI data lack the characteristic contrast of deoxyhemoglobin.

Thus, I believe that baseline blood volume values that are derived from immunochemistry of ex-vivo samples might not be the best choice to validate or discredit the signal magnitude of VASO.
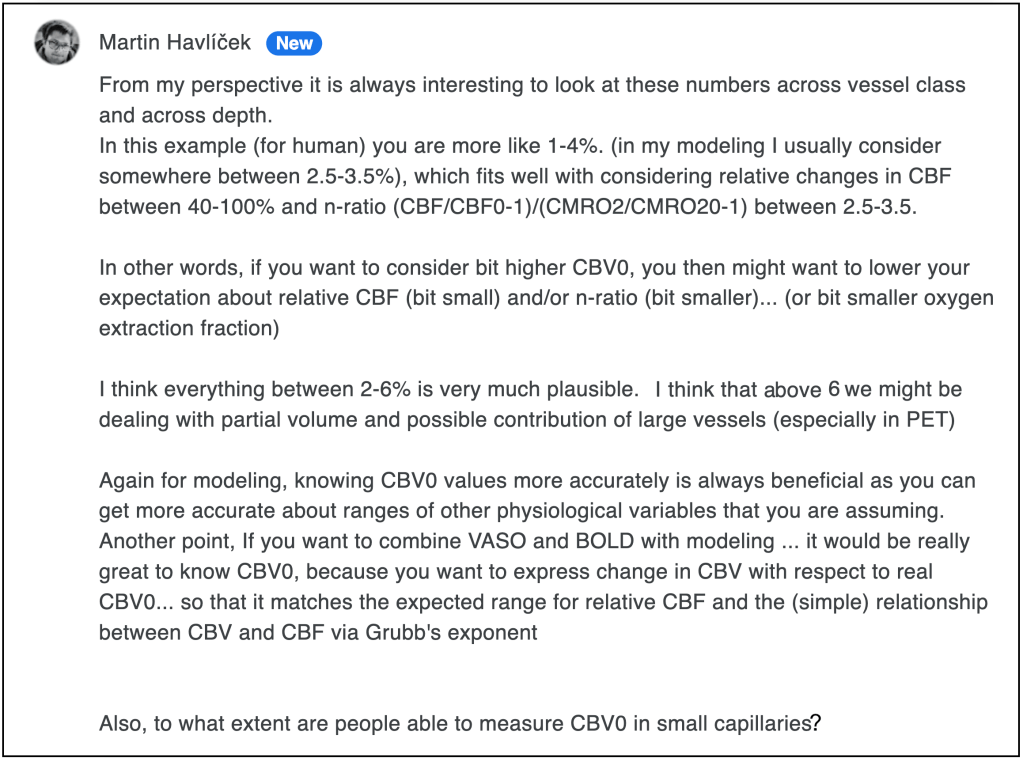
The modeling perspective (from Martin Havlicek)
I had asked Martin Havlicek about his opinion about the section above and he brings in a fresh perspective from the side of laminar fMRI modeling:
Personal recommendation for VASO quantification
Even after several decades of investigating baseline CBV values and almost two decades of VASO methods development, there is no consensus across experts in the field, what the best value is. It looks like the exact value is different across species, across cortical depths and less so across brain areas. This uncertainty of the assumed baseline CBV values, might hamper the reproducibility of VASO results across the next decades and research labs. Namely, emerging evidence of the exact baseline CBV value in the next decades and each research lab’s preference to pick values from the increasingly large body of literature, different CBV results will be reported based on the same VASO signal change.
In order to avoid potential biases of the CBV signal in VASO and to minimize reproducibility issues across sites and analysis pipelines, I would recommend to report blood volume changes in VASO without utilizing an assumed baseline CBV value. I recommend reporting VASO related blood volume changes in its native units of ml of blood volume change per 100ml of tissue (voxel), whenever possible. I would recommend refraining from converting this value to relative blood volume changes in units of ml in blood volume change per ml of baseline blood volume.
If CBV values cannot be analysed in their native units of ml per tissue volume, I would recommend refraining from using assumed literature values and instead employ quantitative empirical imaging of the baseline blood volume of the same subject in the same physiological condition and the same voxel resolution as the fMRI experiment. For example by means of the following CBV quantification with MION with the procedure described in below section of the blog post.
In multiple studies over the last years, estimated the baseline blood volume by means of the steps outlined above. I obtained values that range from 10 ml per 100 ml of tissue above the cortical surface to 1-2 ml per 100 ml of tissue in the deepest cortical layers. The average value in GM is in the range of 5.5 ml per 100 ml of tissue.
These values are in good agreement with other studies of similar methods: Gharagouzloo CA, Timms L, Qiao J, et al. Quantitative vascular neuroimaging of the rat brain using superparamagnetic nanoparticles: New insights on vascular organization and brain function. Neuroimage. 2017;163(September):24-33. doi:10.1016/j.neuroimage.2017.09.003
Quantification of CBV with MION
Signal changes due to susceptibility arising from intravascular contrast agents can be described with the formalism given in (Tropres et al., 2001, Zhao 2006, Kim et al., 2013):
Where, Srest(⍴,T2*, etc.), contains signal parameters that are independent of iron oxide contrast agent intionsion, d is the relative dosage of contrast agent in randomly oriented cylindrical vessels (Yablonsky and Haake 1994), and assuming that CBV << 1, and TE >> 1/(δ⍵) (Tropres et al 2001). Note that CBV refers to the relative blood volume in units of ml per ml of tissue. Contrast agent induced susceptibility change ∆χ(d′) ≈ 0.571ppm × d′ can be taken from the literature (Tropres et al., 2001; Kennerley et al., 2005). The above equation can be rewritten as:
Which can be further simplified to:
where the slope of the contrast agent induced signal decay is directly proportional to CBV. In most applications ∆R2∗ ≪ TE and the relative signal change is linear dependent on the susceptibility. At high magnetic fields or in voxels with very short T2∗, this is not completely valid anymore and the decay must be considered to be exponential. Based on the measured change in R2∗, the above equations can be used to estimate CBV:
Contrast doses are usually in the range of 7 – 9 mg/kg to have a maximum contrast with minimum intravascular signal, but to still have enough extravascular signal left for acquisition. In order to minimize contaminations of susceptibility changes arising from the blood oxygenation level, measured signal intensities S(d′) and S(d = 0) should refer to the same activation state. This means that for one measurement of activity induced CBV, two functional experiments must be conducted, one before contrast agent injection and one after contrast agent injection.
Acknowledgement
- I want to thank Martin Havlicek for helpful comments on this post.
- I want to thank Kamil Uludag for reaching out about a potential mismatch of the assumed baseline CBV at this Twitter exchange.
- I want to thank Natalia Petridou for literature recommendations.
- I want to acknowledge the contributions from Bob Turner tips to references of the latest iron-oxide based quantifications of baseline CBV.
- I thank Michaël Bernier for discussions about Feraheme based estimations of baseline blood volume.
- I want to thank Natalia Petridou for discussions that also lead to this blog post.

Isn’t it also important to differentiate between arteriole and venuole compartments? The former are expected to be compliance vessels, capable of dilating, whereas the latter may do so only passively, if at all. Measuring total CBV – arterioles, capillaries, venuoles – would then lead an overestimate of the potential delta-CBV. I think we seek CBVa for VASO, with CBVv being a relatively inactive compartment.
Another point about making measurements in vivo, especially in humans: the level of arterial CO2. I think you’d want to take an average of several measurements, making sure the subject isn’t inadvertently hypercapnic, e.g. falling asleep and experiencing apnea. (Hypocapnia seems unlikely without hyperventilation.)
Cheers!
LikeLike
I find it interesting how different methods for measuring blood volume have historically reported their findings.
LikeLike